
Optimize ROP, Minimize Shock & Vibe
Connect geology, drilling, and machine learning to keep the bit on the optimal path. Visualize ROP sweet spots to stay in the most productive zone, while minimizing shock and vibration to your BHA.


ROP Sweet Spot Visualization


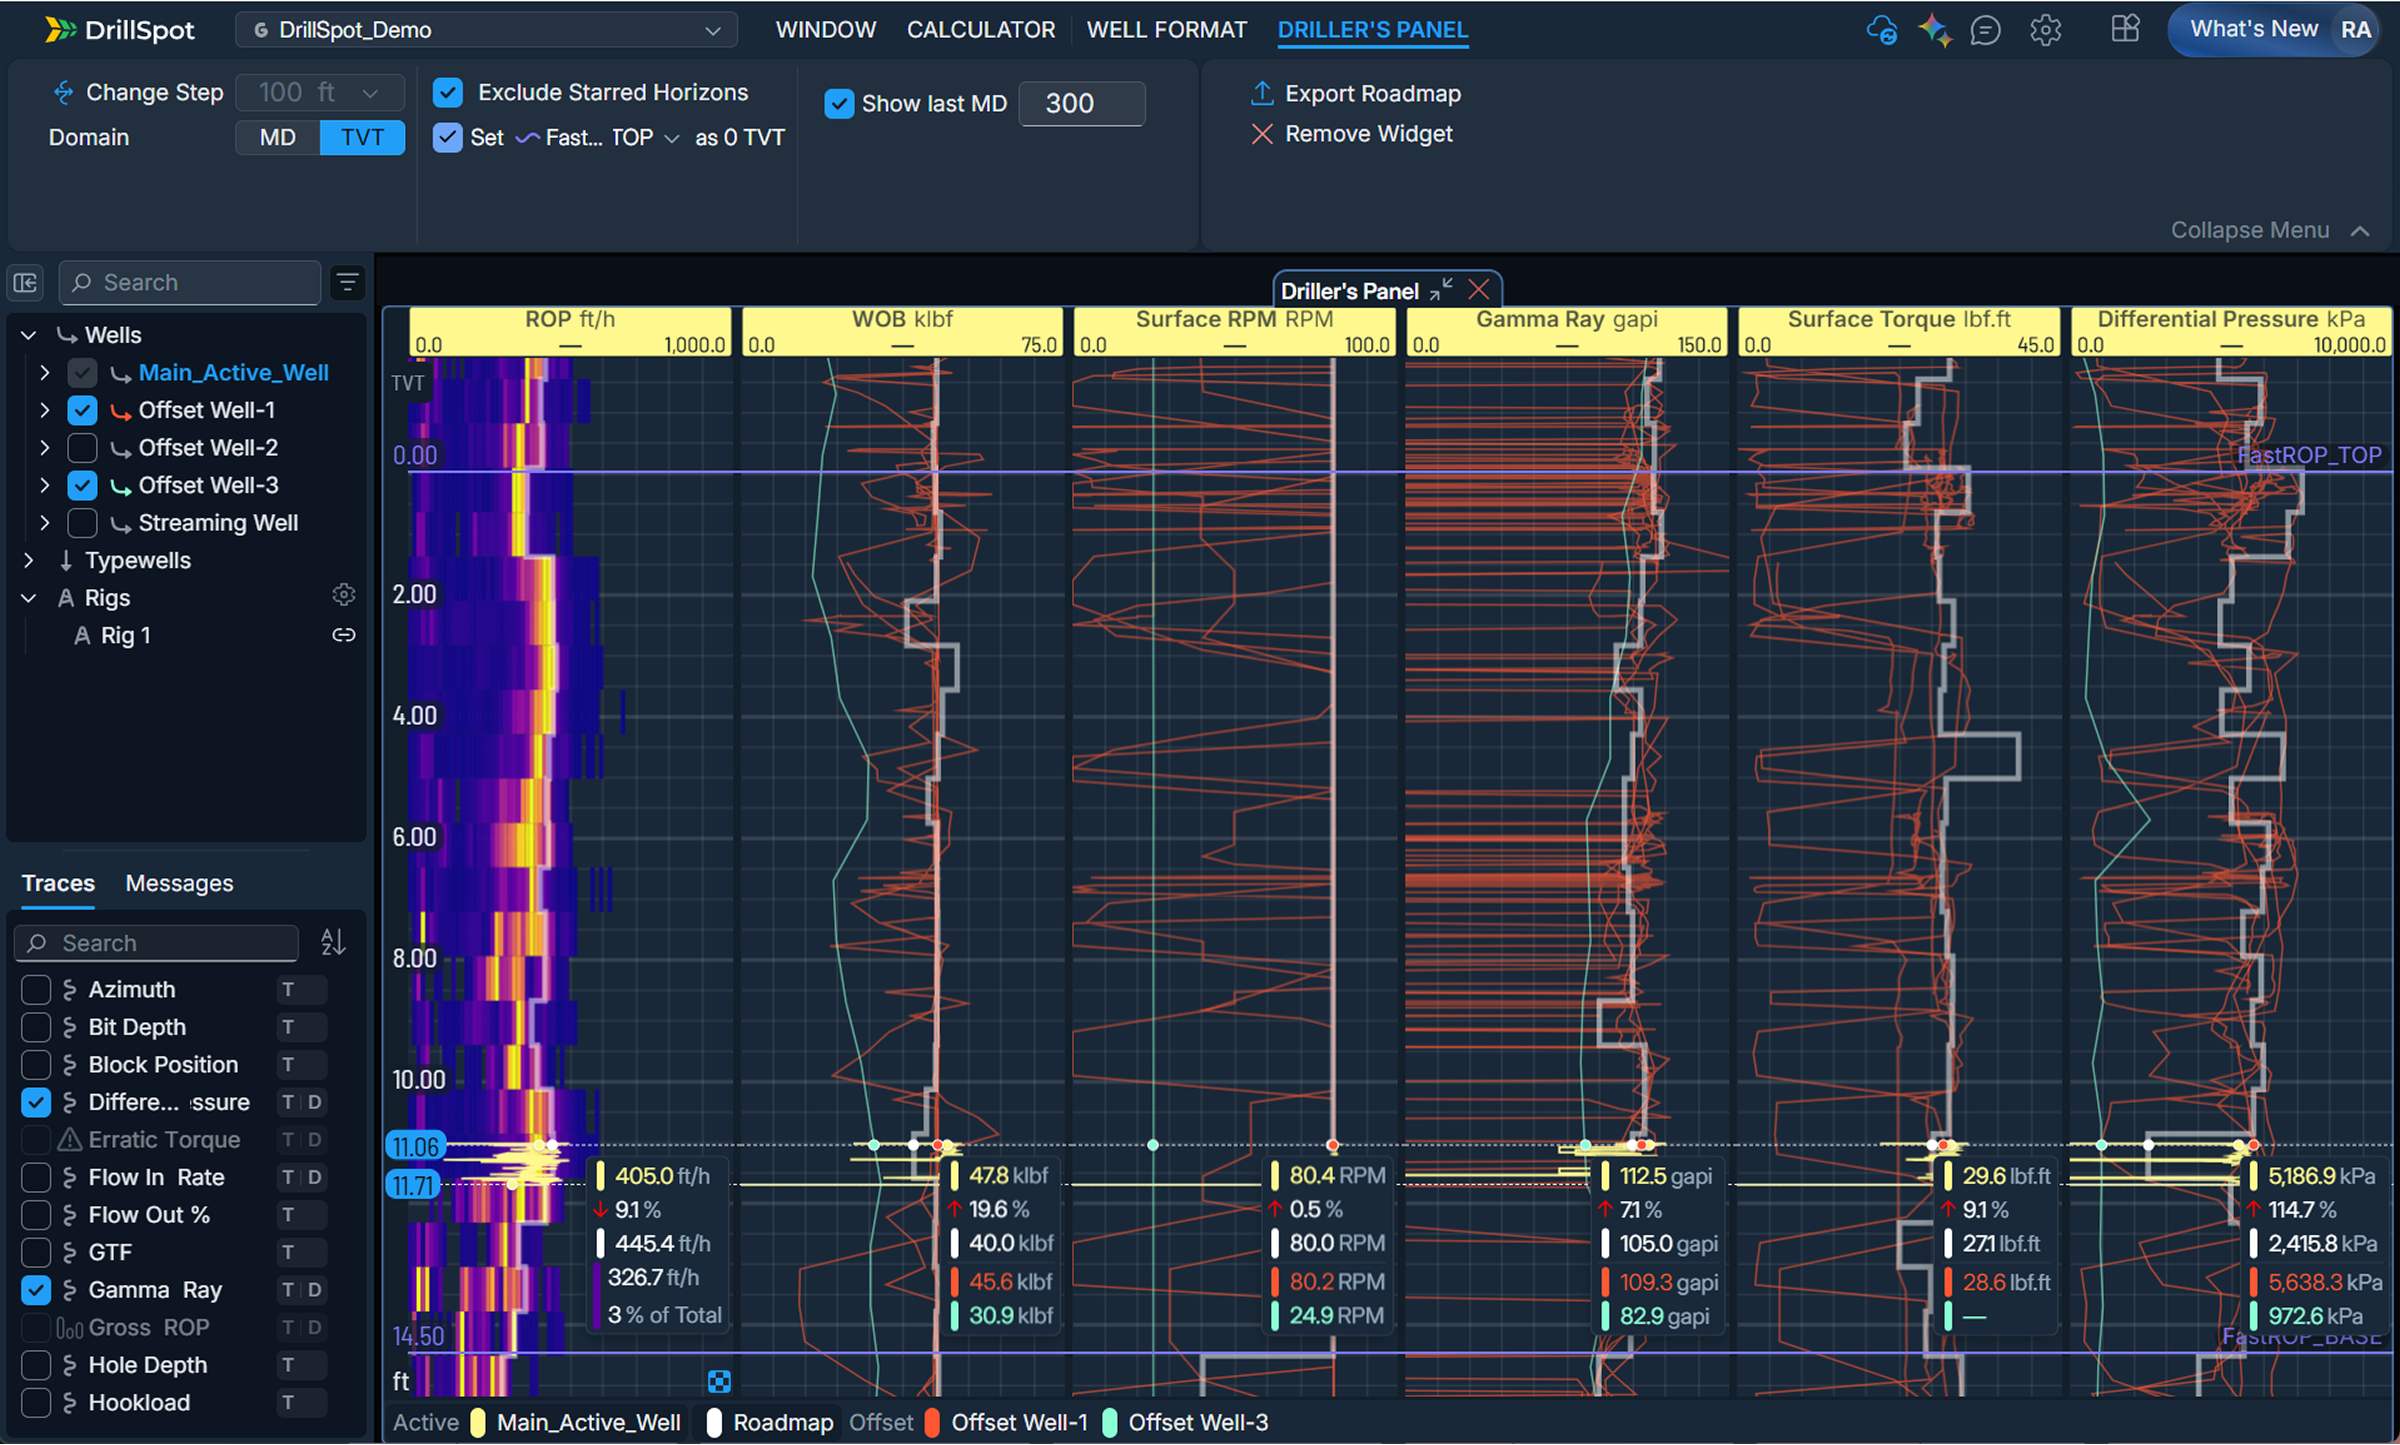
Generate more than just an ROP heatmap, select any trace from offset wells to determine optimal drilling parameters in the Driller’s Panel. View your roadmap in the dashboard or export as .xlsx for in-depth real-time decision making.
Features:
- Generate roadmap curves and heatmaps for any trace
- Normalize ROP to formation tops
- Plot horizons of Target Window
- Visualize target window in TVT scale
- Compare current ROP to offset wells
- Heatmaps highlight optimal drilling parameters
- Connects ROP anomalies to specific formations
- Supports real-time and historical evaluation modes
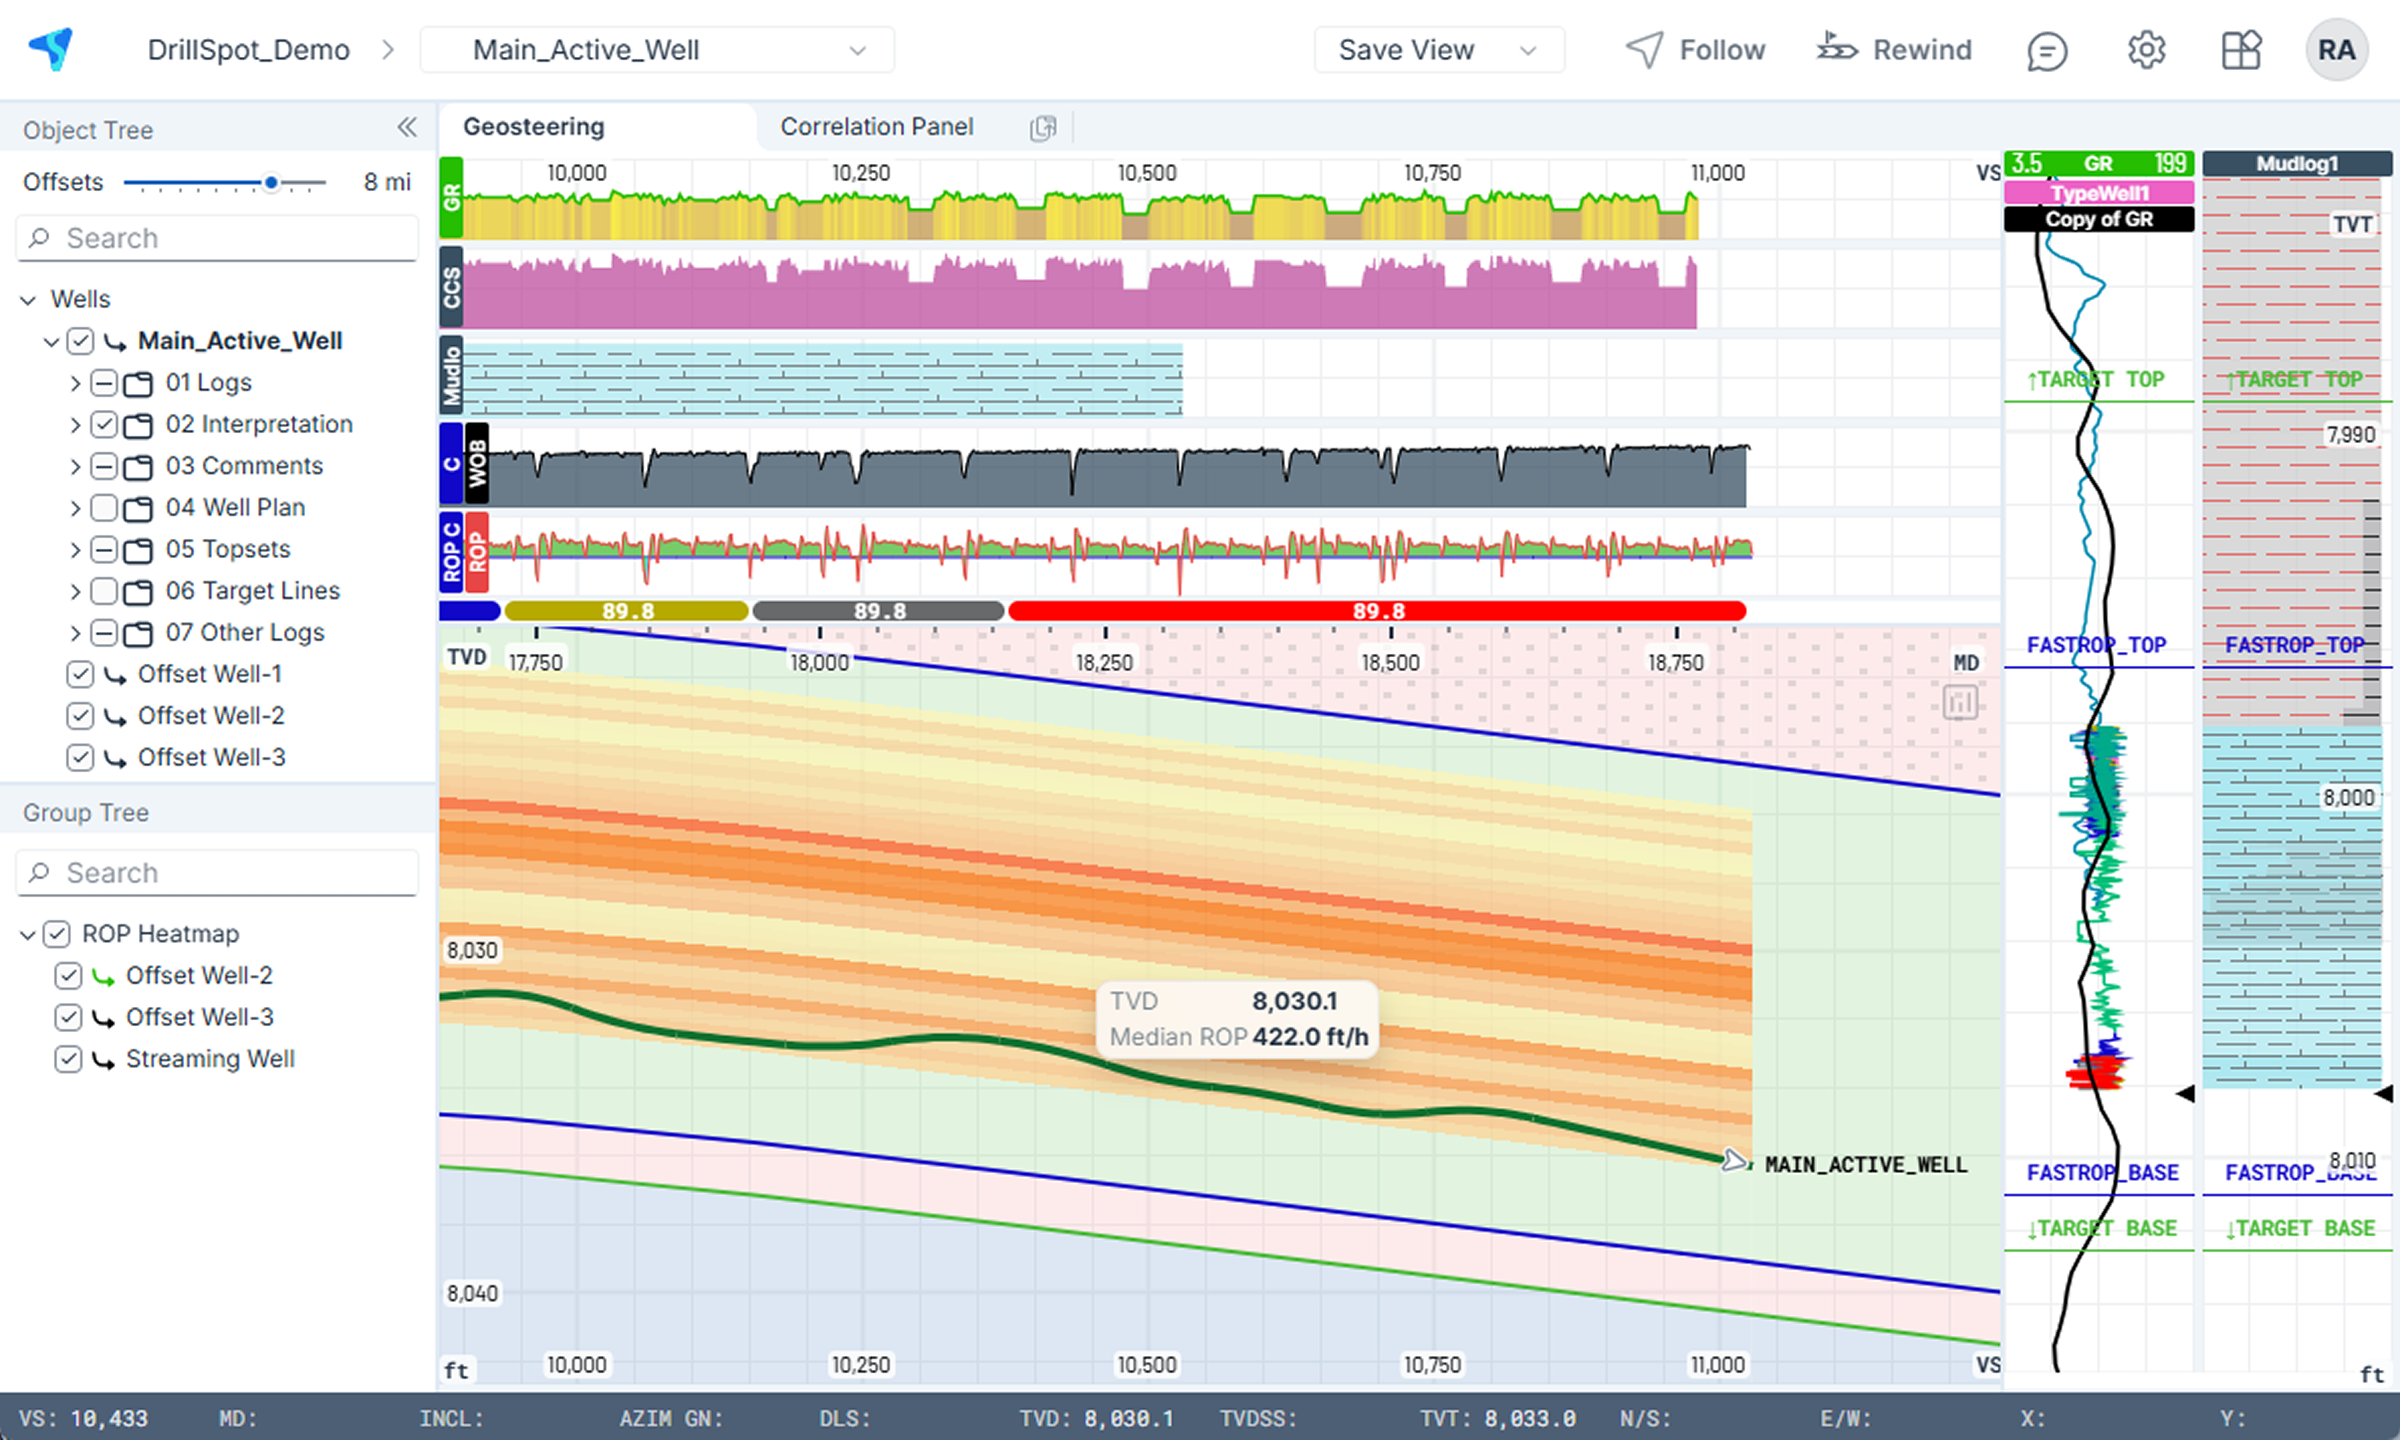
StarLite calculates ROP trends along the geosteering window based on multiple offset wells, allowing you to refine target lines toward more drillable rock.
Features:
- Filter offset wells by radial distance to active well
- Plot one or multiple offset well ROP heatmaps
- Revise your target line or well plan to follow high ROP zones
- Plan future offset wells within sweet spot intervals
- Optimize slide and rotate intervals
- Hover over to see Median ROP values
Control Shock, Vibration, and Dysfunction
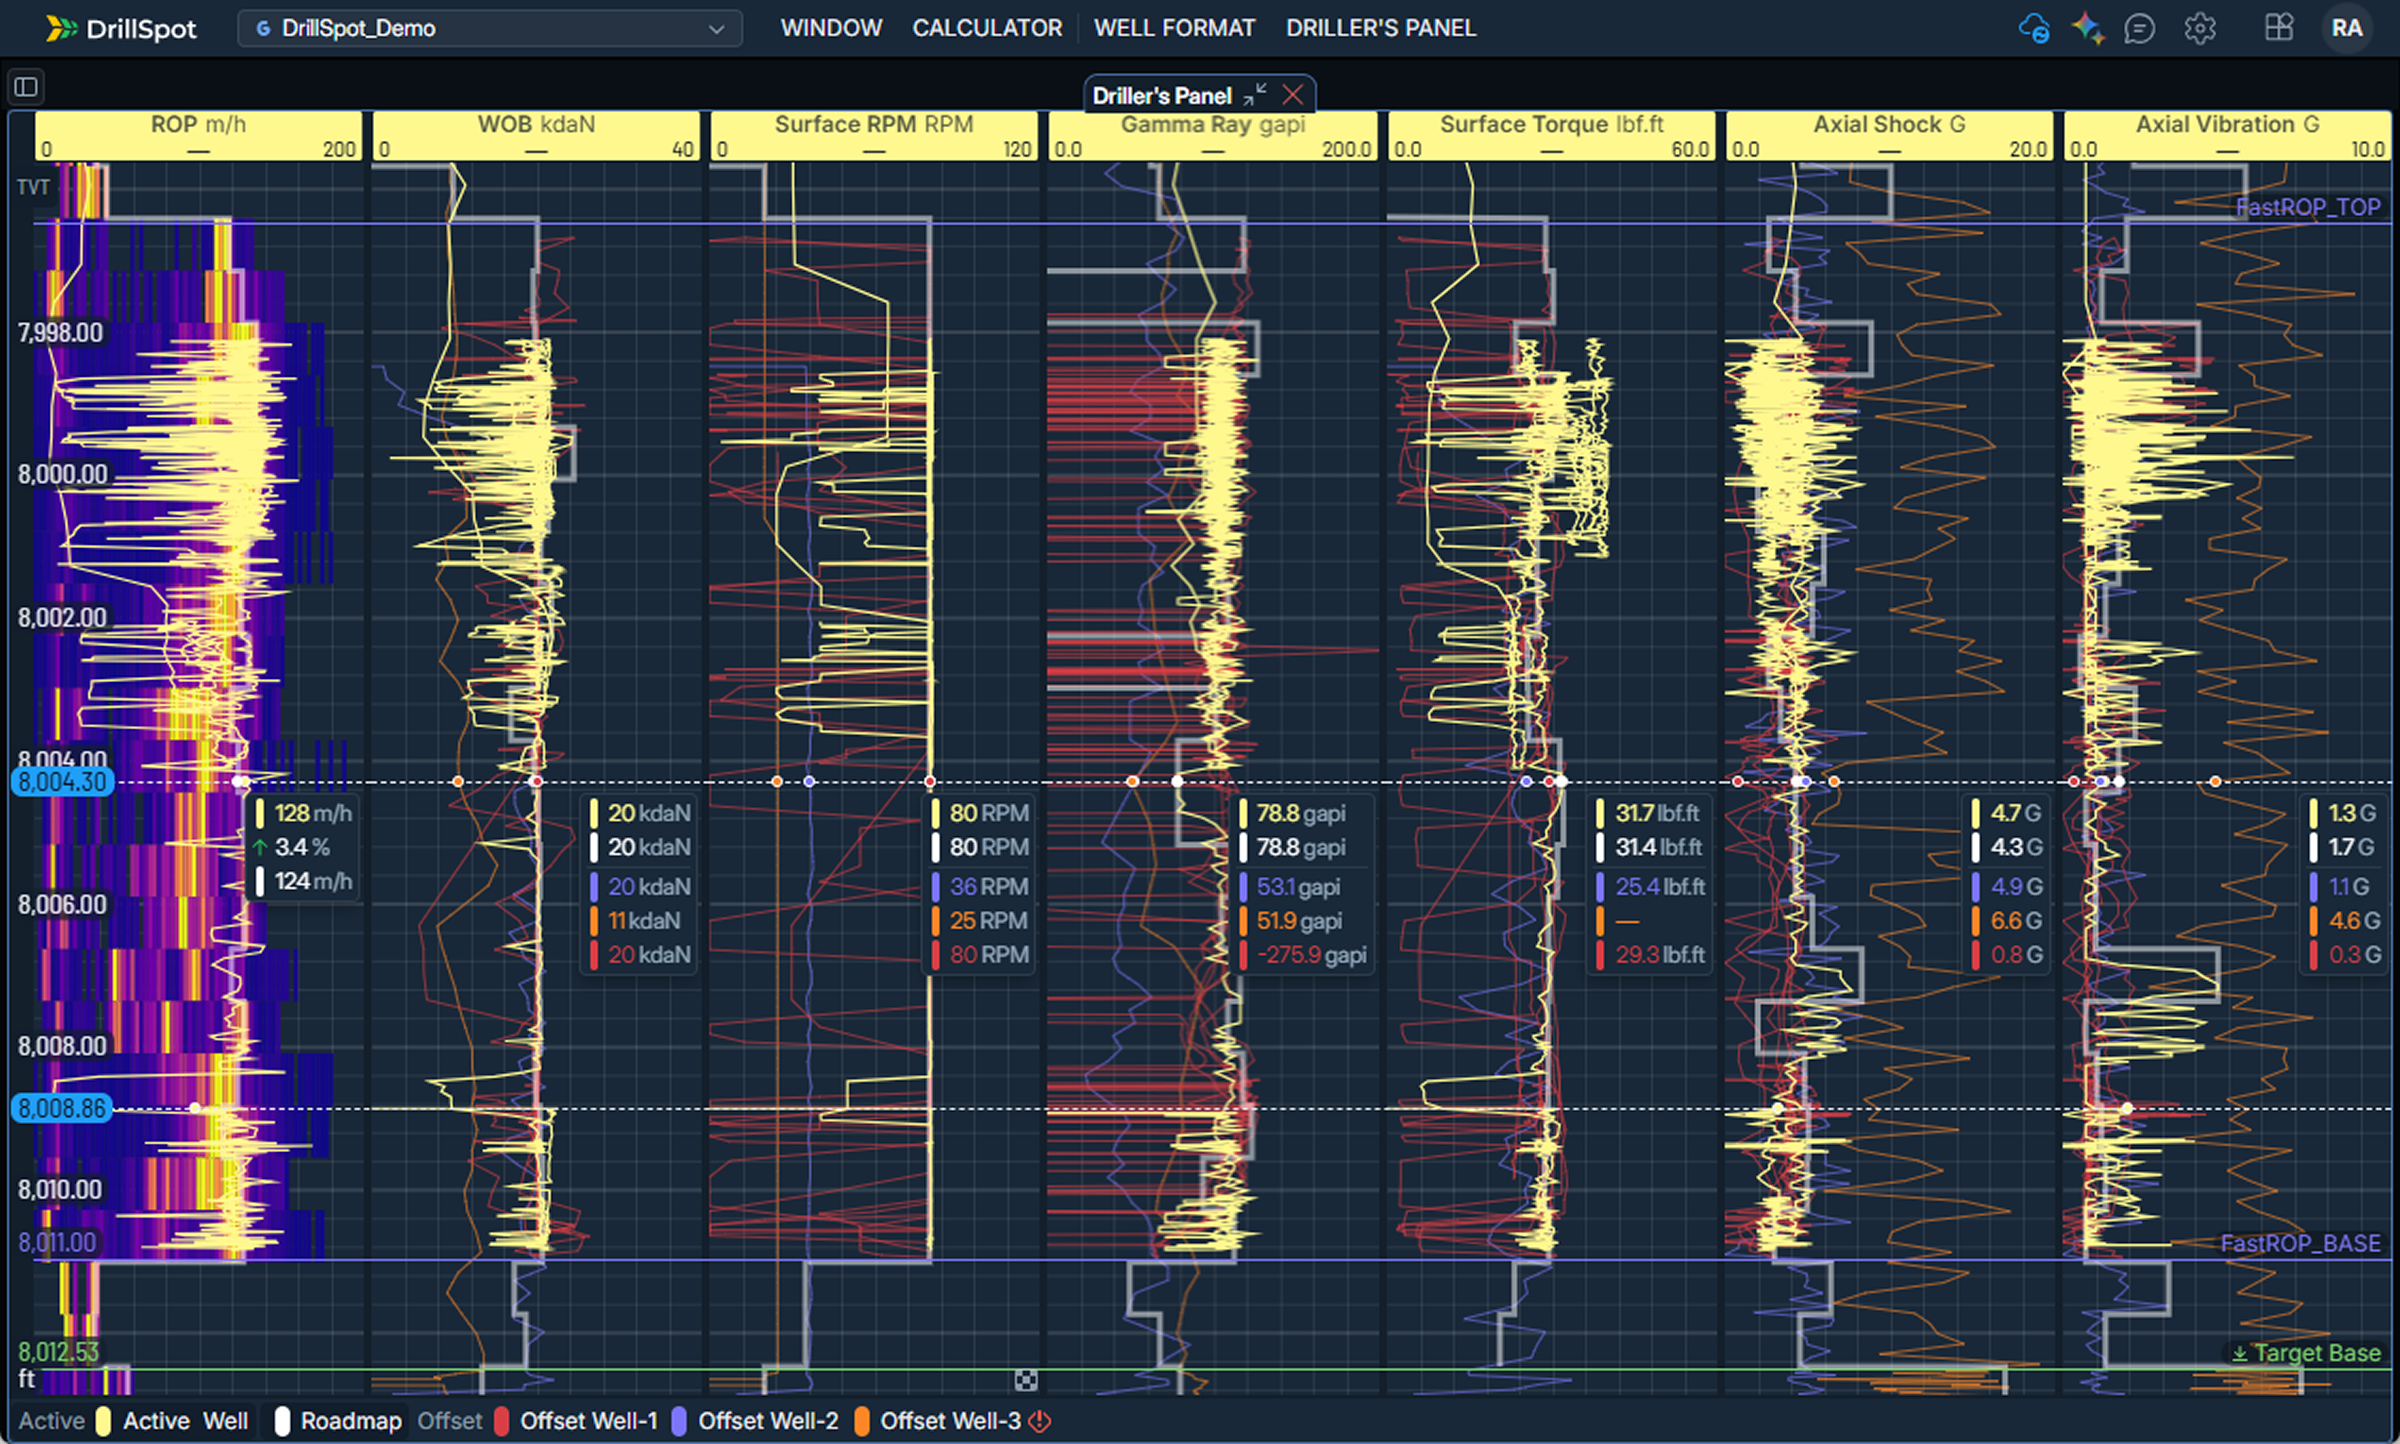
DrillSpot feeds any of your drilling parameters to StarLite. Identify problematic zones in your target window by visualizing shock, vibration, and ROP data so you can react before damage accumulates.
Features:
- Monitor shock and vibe trends on horizontal track
- Hover over to identify key values
- Adjust drilling parameters to mitigate shock and vibe
- Plan low shock and vibration sweet spots in target window
- Shared view for multi-disciplinary alignment
- Revise target lines to avoid high shock & vibration zones

Interactive X‑plots can correlate drilling parameters with shock, vibration, and ROP, enabling quick identification of stable operating conditions and repeatable mitigation protocols.
Features:
- Plot ROP against WOB and RPM
- Color points by shock, vibration, or rig state
- Lasso stable clusters to define operating “sweet spots”
- Compare parameters before and after mitigation changes
- Save plot presets for different tools and BHAs
- Jump from crossplots back to depth‑time context
- Auto-run lookback windows around shock events
- Export crossplot images and statistics for reports

By normalizing drilling data to tops and TVT, DrillSpot helps teams distinguish shock & vibration trends. Easily identify if the dysfunction is caused by rock, drilling parameters, or BHA configuration.
Features:
- Normalize drilling traces to tops and TVT framework
- Overlay vibration hotspots on windows and targets
- Separate rock-driven shocks from parameter dysfunctions
- Compare dysfunction frequency relative to target window
- Correlate lithology with torque, shock, or vibration spikes
- Using MD scale, flag formations with high dysfunction
- Use TVT normalization for cross-pad benchmarking
- Feed geological context into BHA redesign and roadmaps
Morning Call & Lifecycle Dashboards

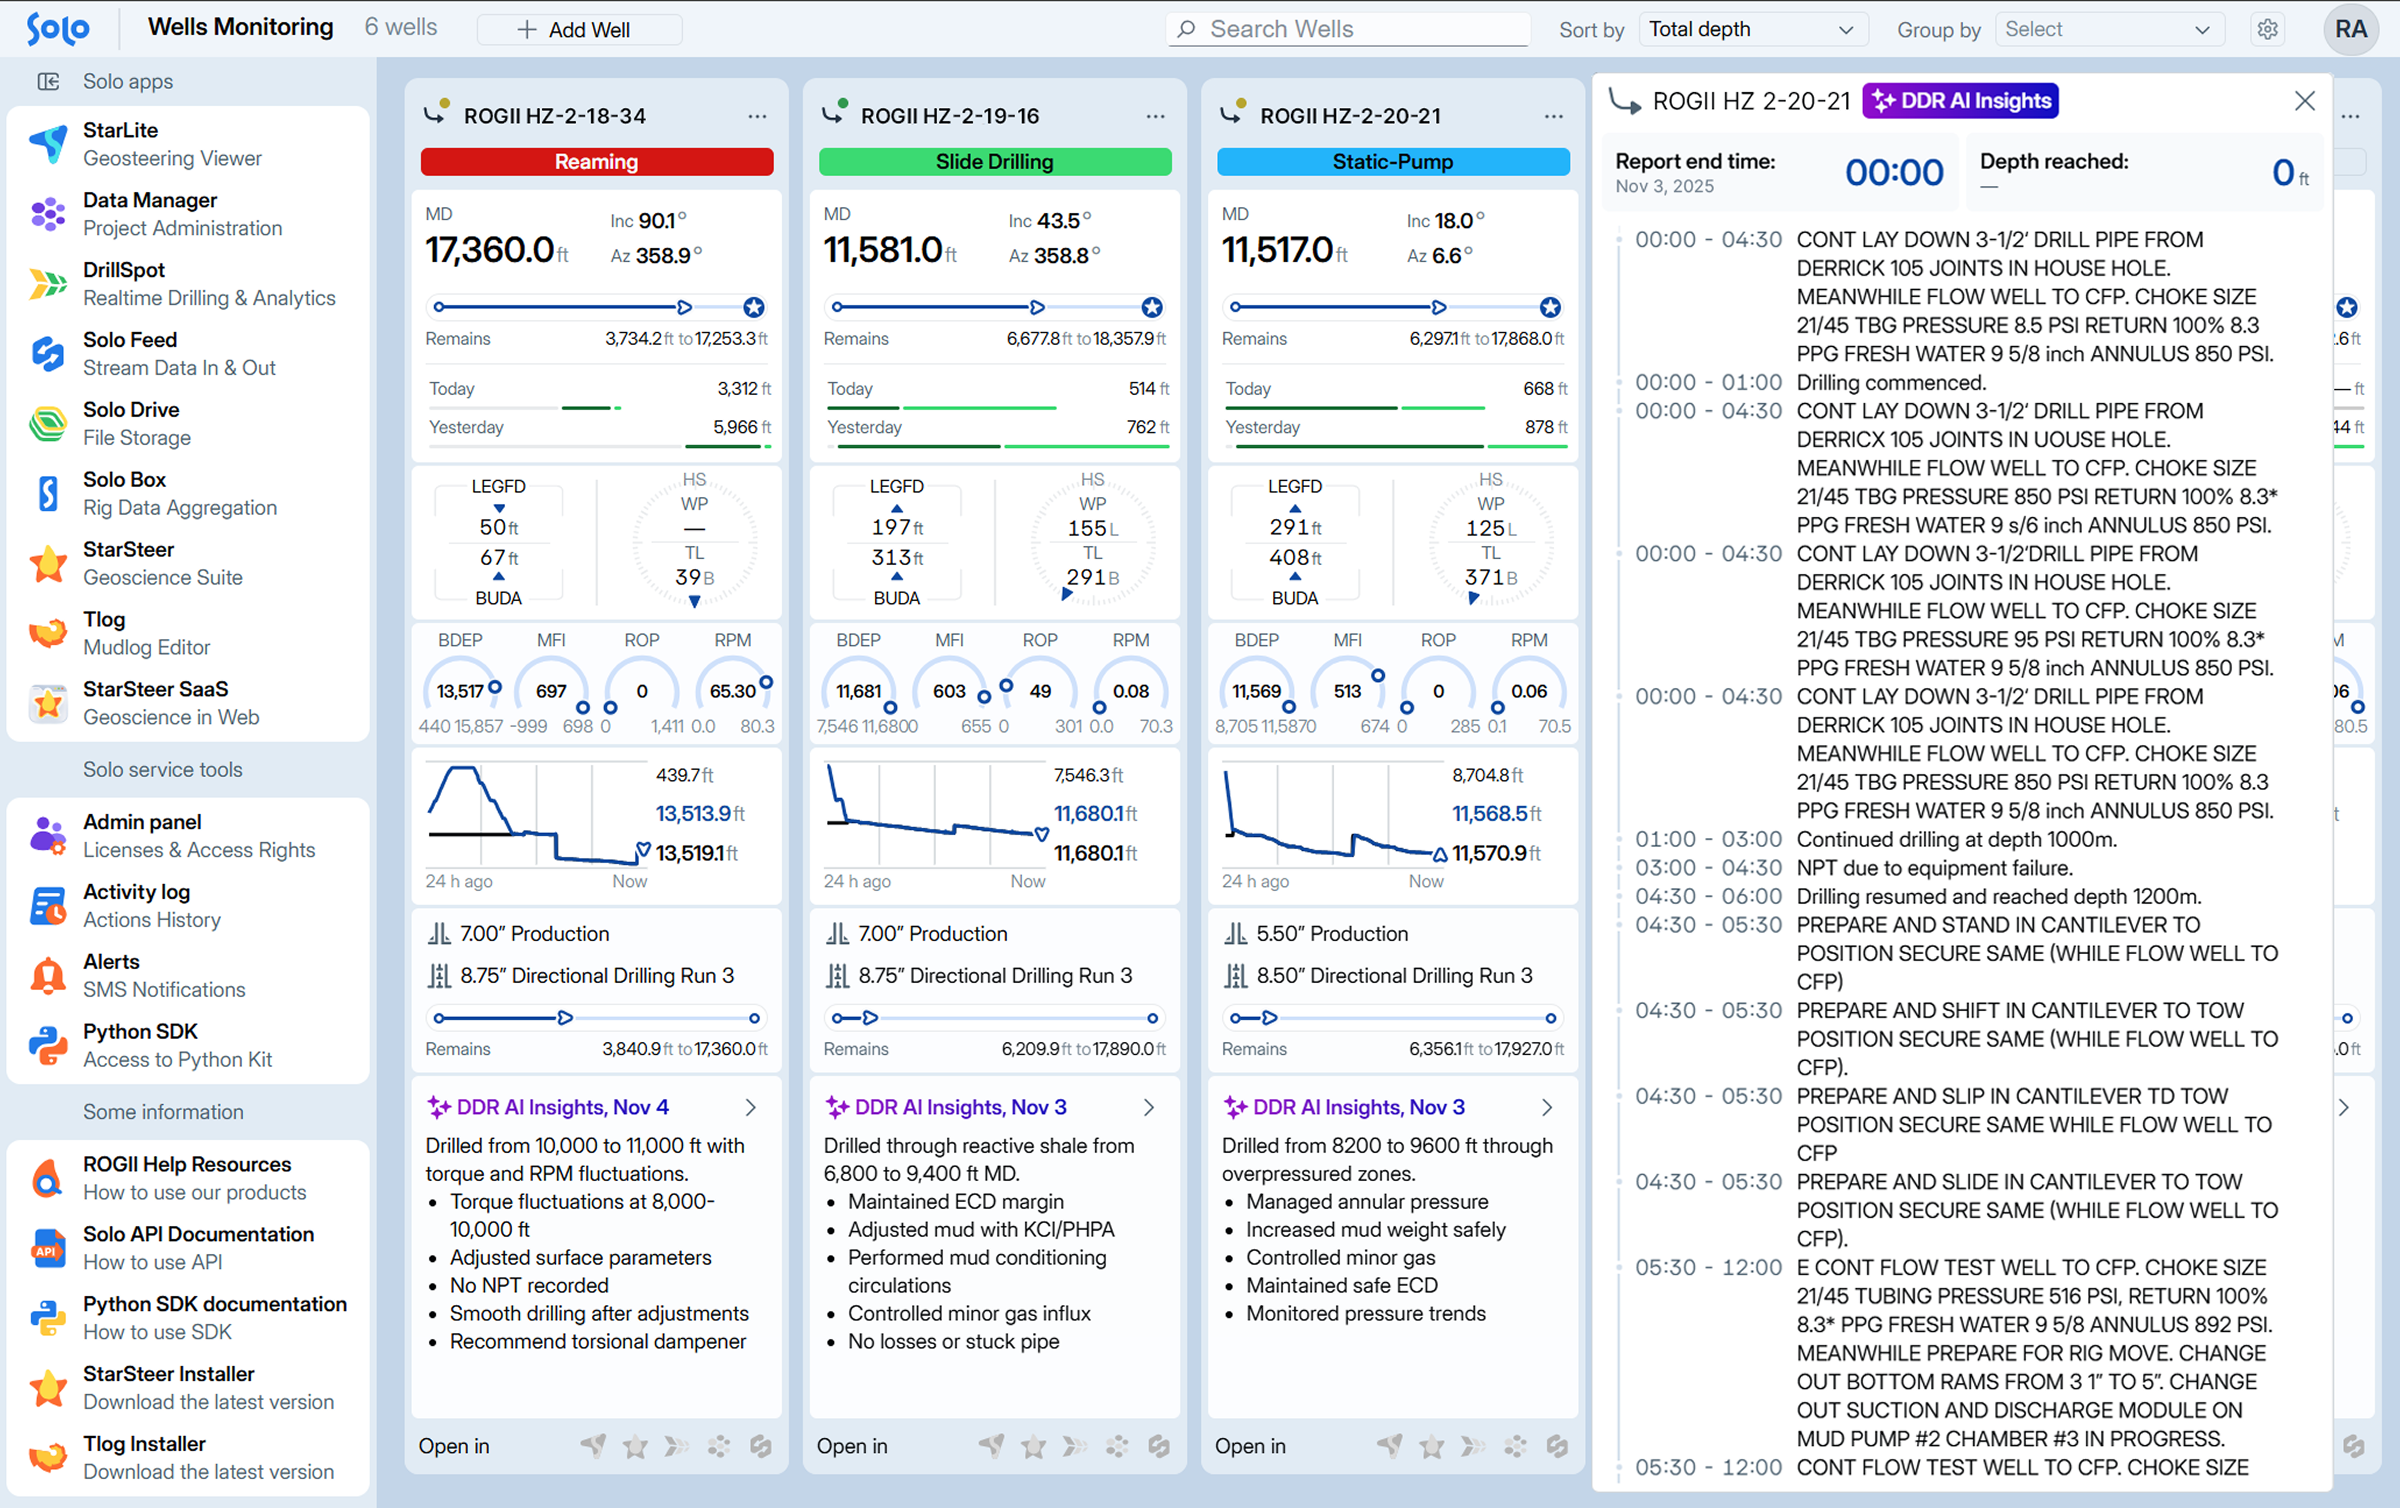
BOSS Dashboard and DrillSpot summarize ROP, key drilling KPIs, configurable time‑trace gauges, DDR comments, and geosteering status on well cards, aligning geology and drilling teams during planning, execution, and post‑well reviews.
Features:
- Summarize ROP, well data, and KPIs on well cards
- Embed DDR insights alongside drilling context
- Show real-time rig status and activity phases
- Track drilling parameters alongside target lines
- Surface key events, dysfunctions, and mitigation notes
- Sync geoscience and drilling teams in one place
- Standardize morning call structure across teams
- Filter wells by pad, operator, or phase
Assess current well performance based on activity breakdowns and offset well comparisons. Plot Rig Activity with the KPI widget and display Days vs. Depth curves to get a quick pulse on your well’s performance.
Features:
- View rig activity breakdowns in stacked column charts
- Plot days vs. depth for active and offset wells
- Visualize tops directly in days vs. depth window
- Offset well top depths are normalized to the active well
- Visualize hazards on the days vs. depth curve
- Filter time range to 12hr, 24hr, 3 day, or 7 day intervals
- Compare active well performance to offset wells
- Filter by on-bottom time, hole sections, or tops

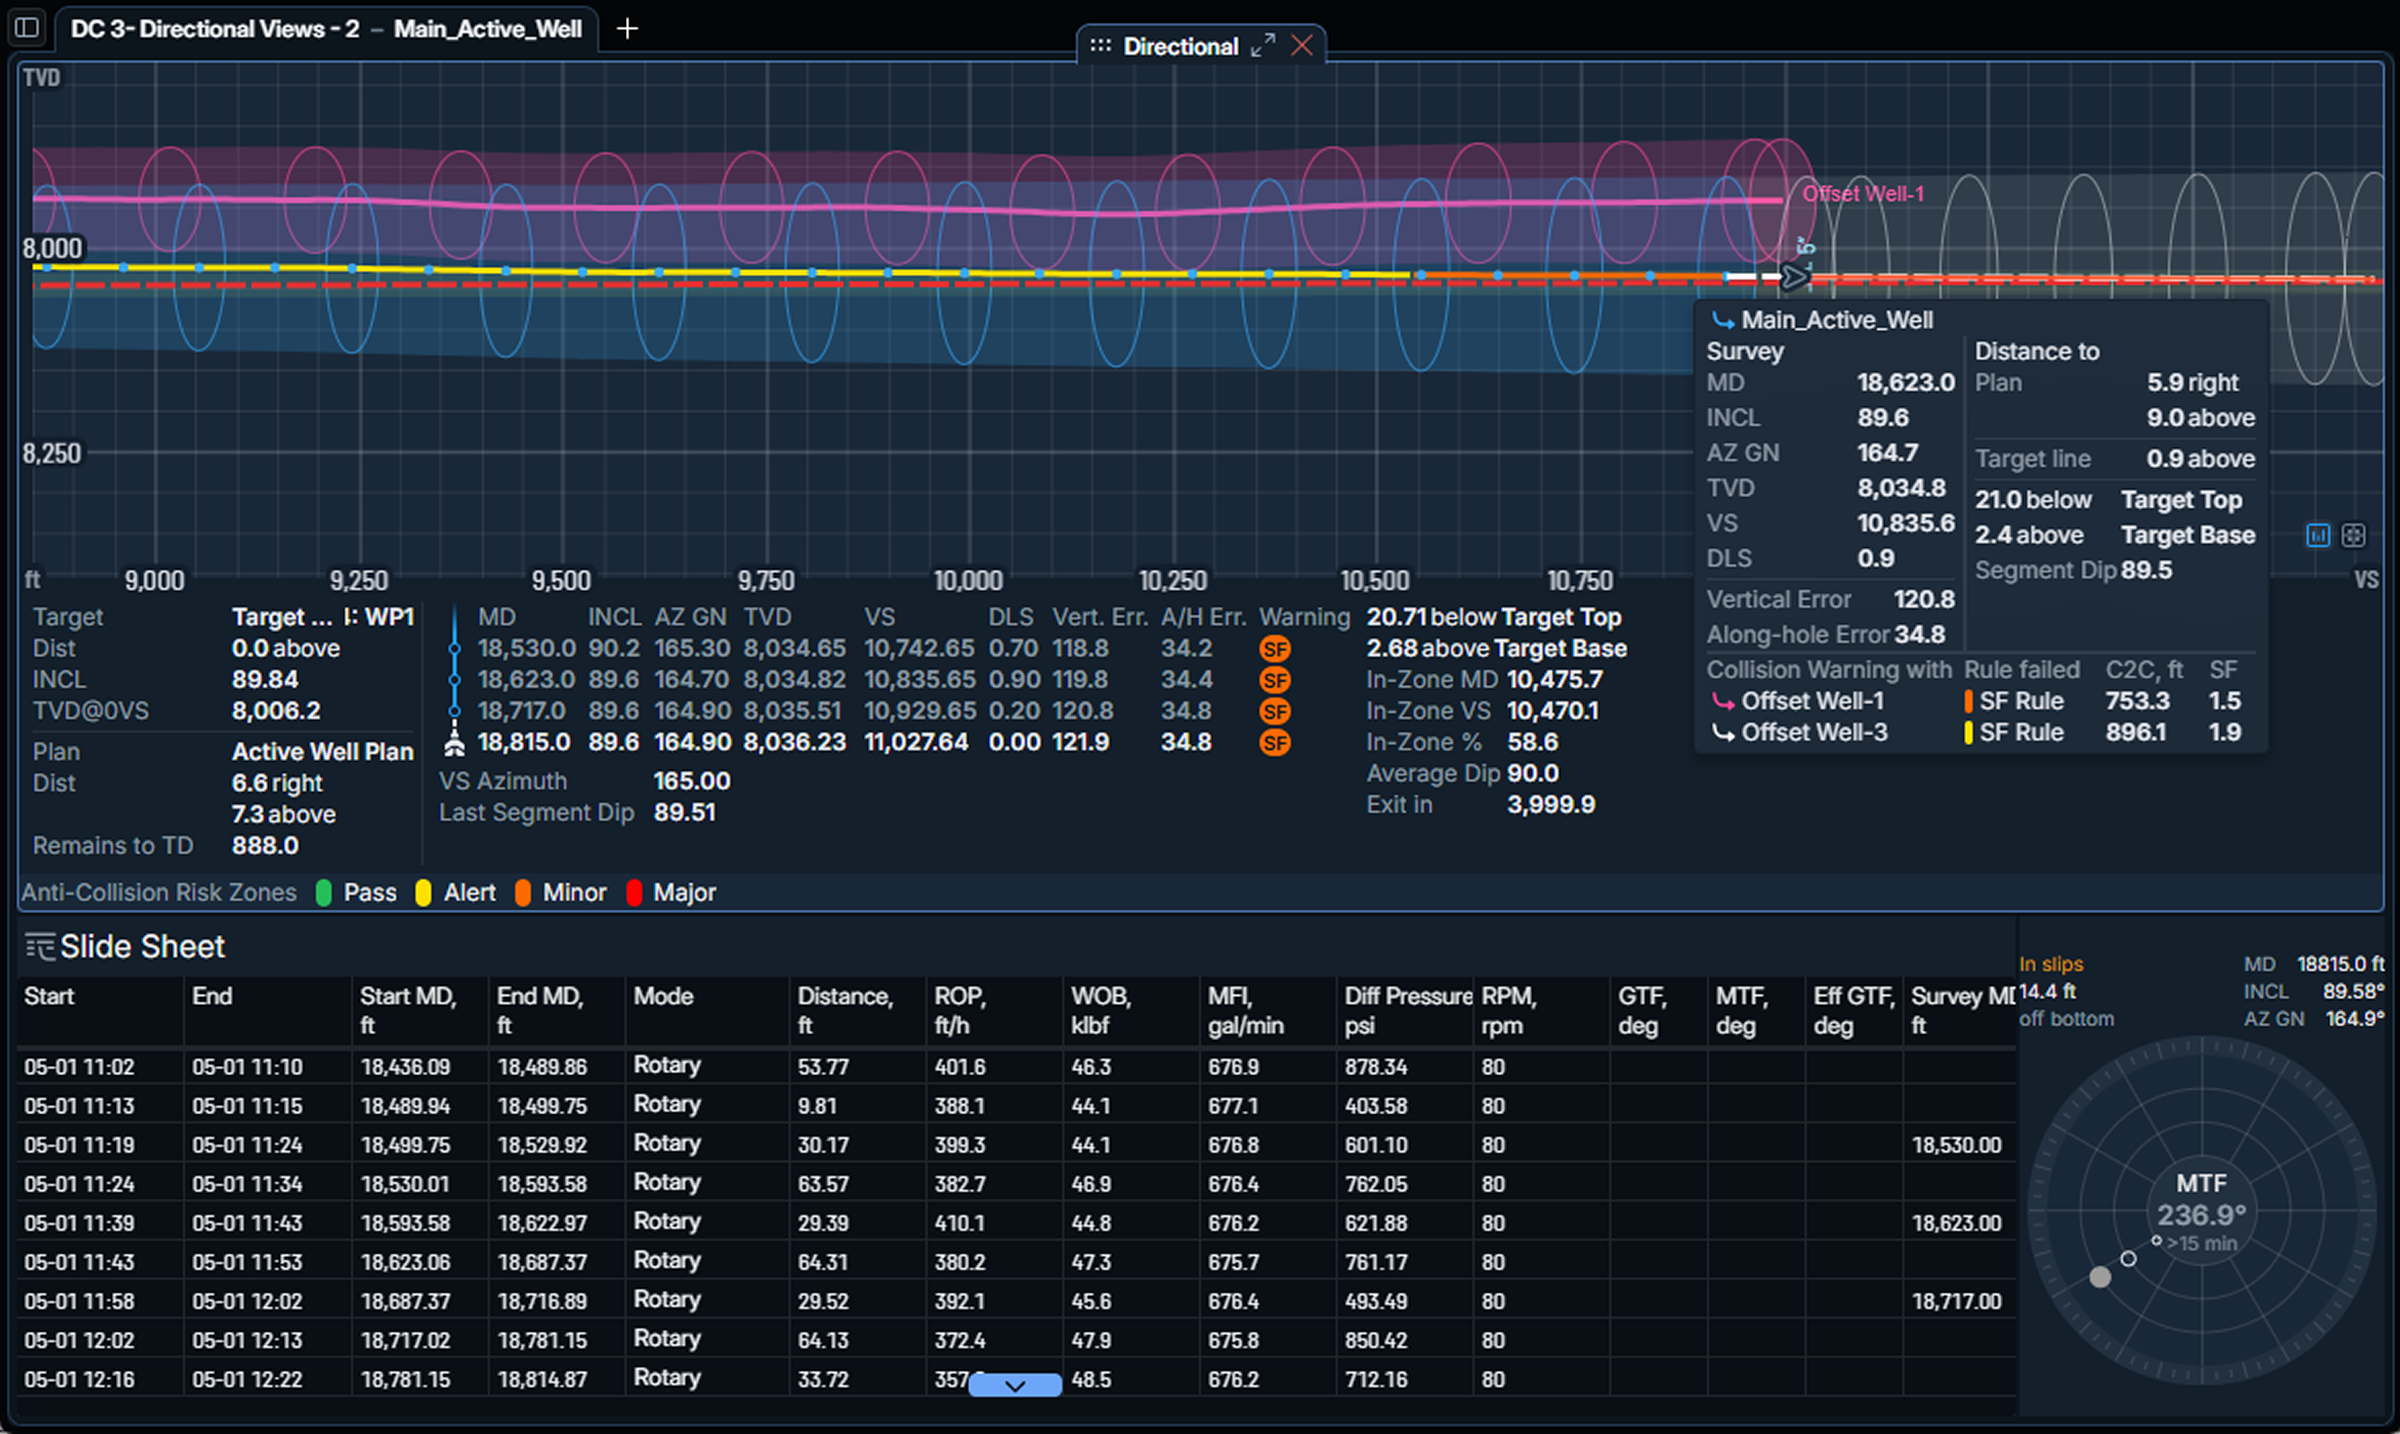
Use DrillSpot to visualize ellipses of uncertainty on offset wells in real-time with cross section, map, and 3D views. Manage collision risk with user-defined separation factor calculations and anti-collision rules while drilling.
Features:
- Visualize ellipses of uncertainty around trajectories
- Apply user-defined separation rules and warnings
- Display anti-collision risk zones in Directional Widget
- Flag high-risk segments with color-coded proximity bands
- Compare planned and actual surveys in real time
- 3D view and Cross Section view supported
- Bring in offset well data from SDF or a third-party
- Plot target lines, well plans and bit projections
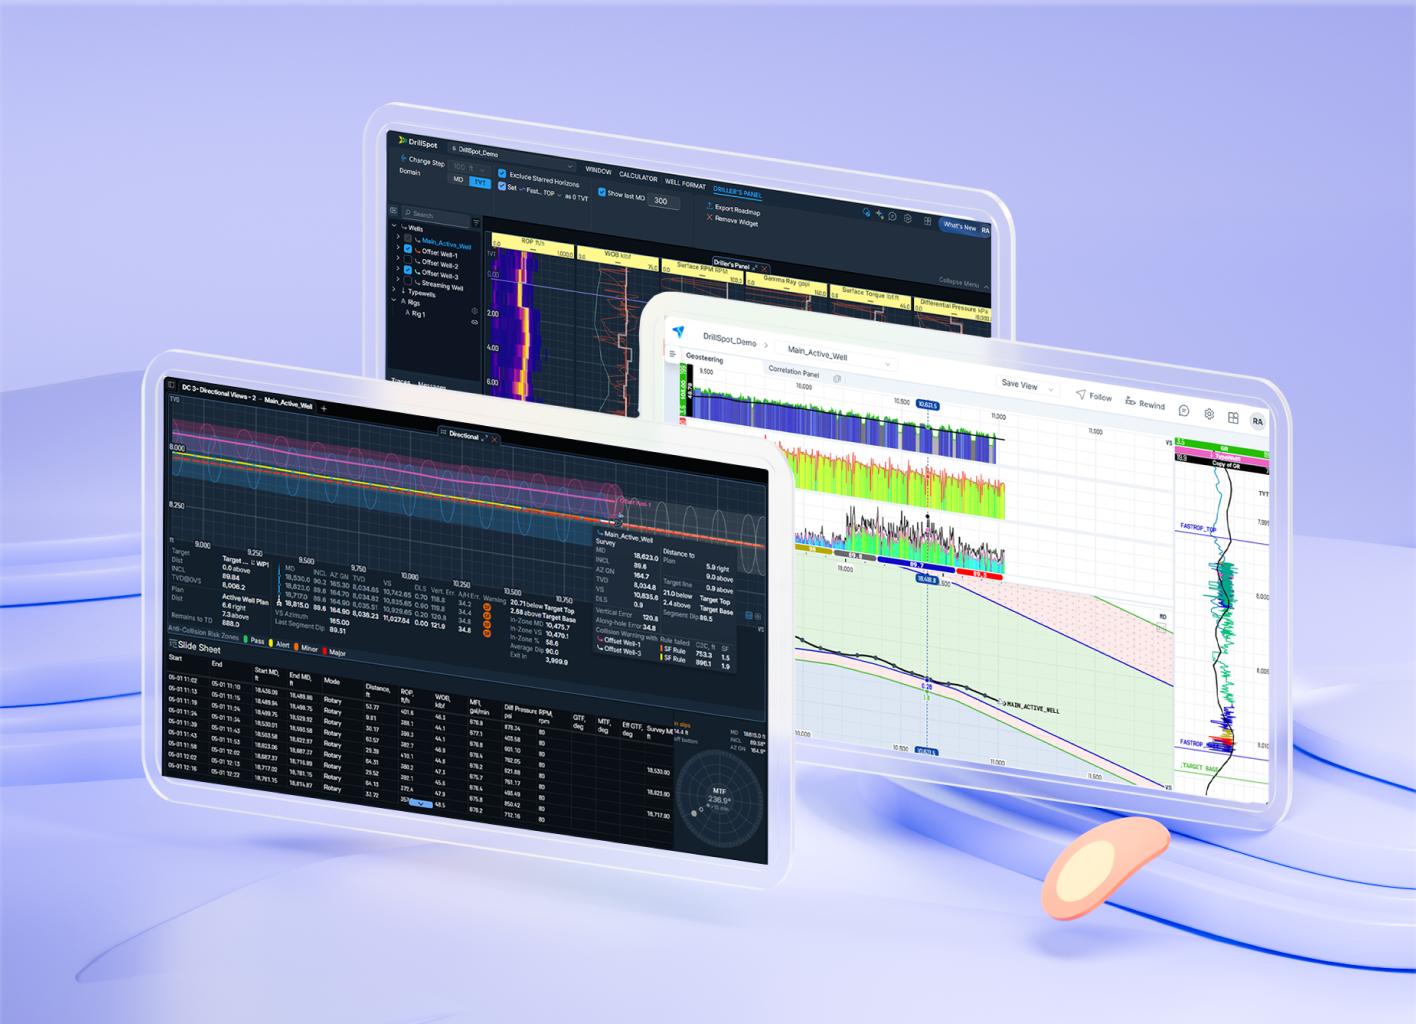
Key Benefits
Geology Driven Drilling Decisions
Tie drilling decisions directly to subsurface data
Vendor-Neutral Backbone
Normalize performance across rigs and data providers
Multidisciplinary Alignment
Keep geology and drilling teams working on the same page
Real-Time Monitoring
Proactively adjust targets & parameters with all of your live data
Request a Demo
Contact us to book a live demonstration on drilling monitoring and optimization
Why Choose Solo Cloud?

ROGII’s Technical Analysts are available 24/7 for support and workflow advice
Cloud Storage
SOC2 certified cloud storage and role based access safeguards your projects
Continuity
Projects are always protected and recoverable in Solo Cloud
Ecosystem
Solo Cloud products link planning, geosteering, & drilling tools in one environment


.svg)